PET imaging of pulmonary perfusion and ventilation using 13N-Nitrogen
Ventilation (V) and perfusion (Q) transport oxygen and carbon in the lungs, and V/Q matching is essential for the efficiency of the gas exchange in the alveoli. However, most pulmonary diseases lead to heterogeneity in V/Q matching reducing the efficiency of the gas exchange. Accurate regional assessments of both ventilation and perfusion are needed to gain deeper insights into the patterns and causes of regional V/Q heterogeneity in different lung diseases.
Our group has developed and refined the 13NN-bolus injection method for ventilation-perfusion imaging using Positron Emission Tomography (PET). This method yields accurate values even under conditions where the distributions of ventilation and perfusion in the lungs are highly heterogeneous. Additionally, it allows the assessment of perfusion heterogeneity not biased by imaging noise.
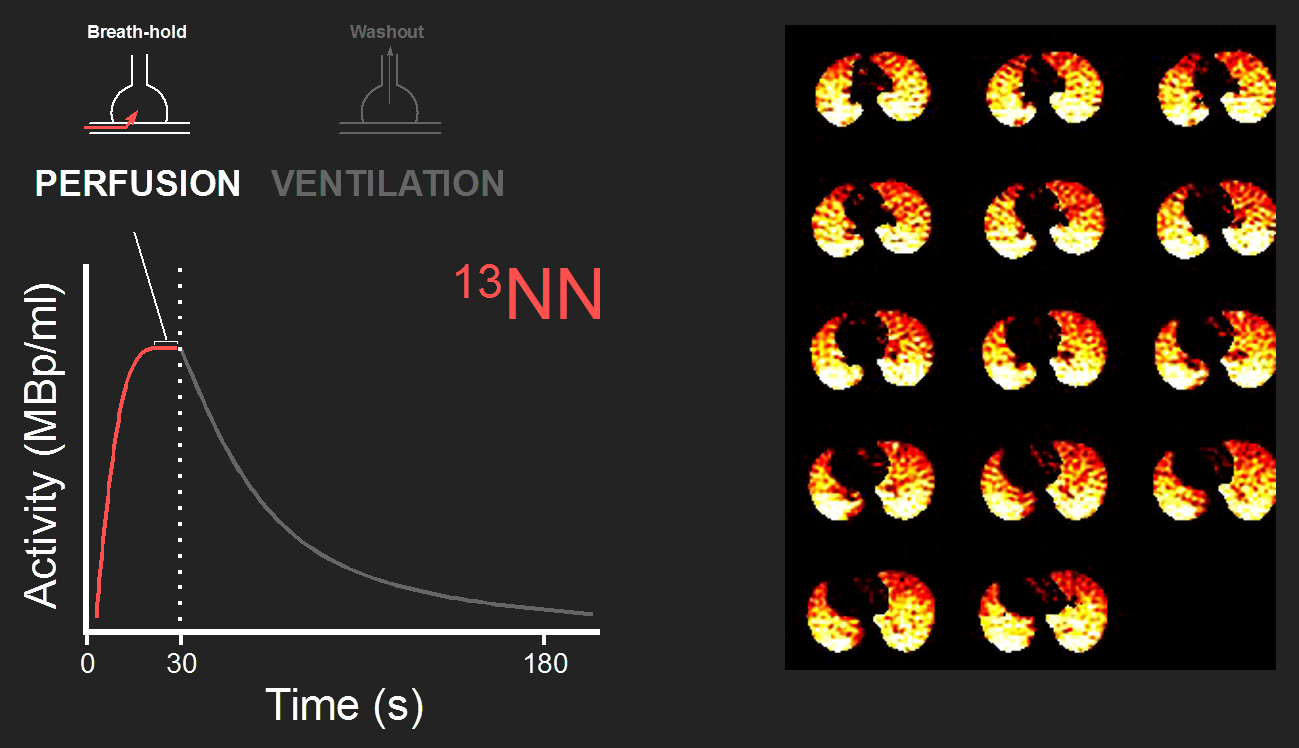
Perfusion
For 13NN imaging, we monitor the tidal breathing of the subject. Perfusion imaging starts with a breath-hold at the mean lung volume between end-expiration and end-inspiration. Simultaneously with the beginning of the breath-hold, a bolus of 13-NN saline is injected intravenously and the acquisition of the dynamic PET scan is started.
When the 13NN reaches the pulmonary capillaries, it diffuses quickly into the alveoli reaching at the end of the breath-hold a plateau. PET images of the plateau phase are proportional to the relative perfusion showing the heterogeneity in regional perfusion in the lungs (Fig. 1).
Ventilation
After the breath-hold, the tracer kinetics of 13NN shows the washout by alveolar ventilation (Fig. 2). The time constant of the washout function is equal to the specific ventilation defines as alveolar ventilation divided by alveolar volume.
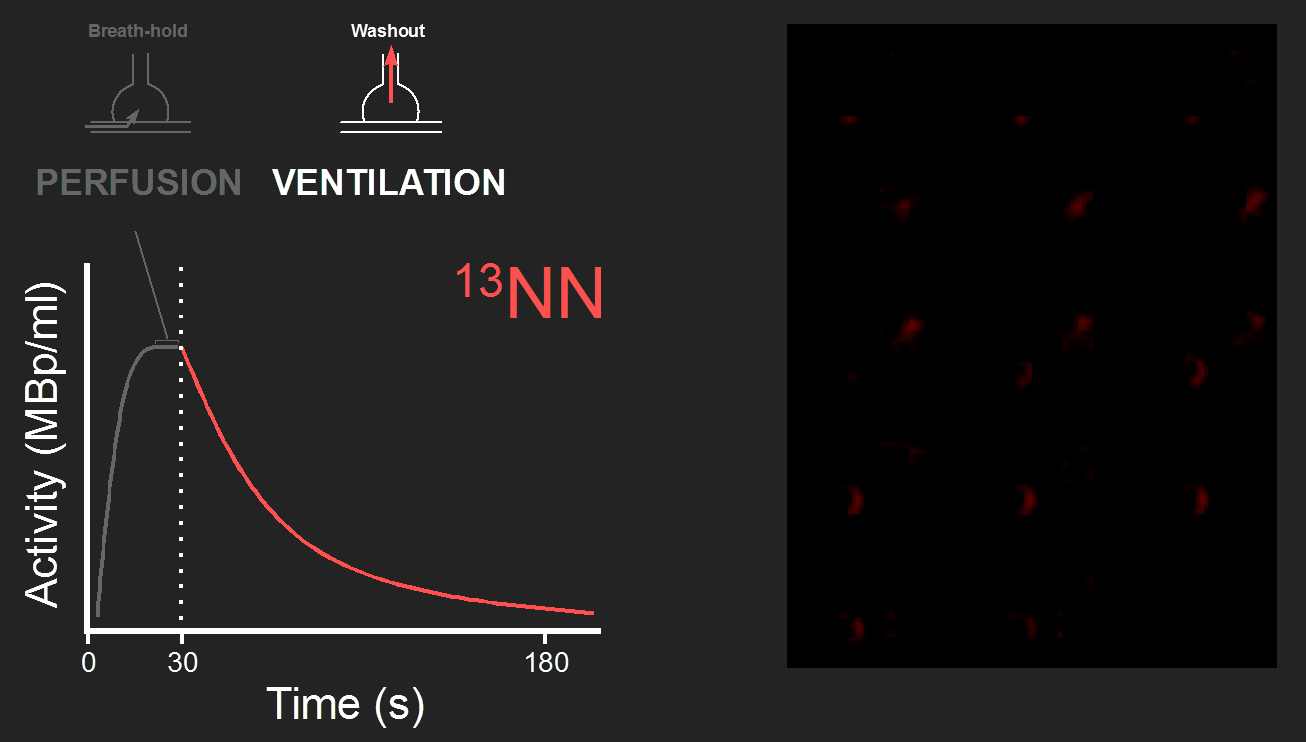
Very low ventilation and complete airway closure result in tracer retention at the end of the washout phase, e.g., a minor degree of retention in the example PET image (Fig. 2). During bronchoconstriction, severe airway narrowing and closure result in ventilation defects (VDefs) with very high tracer retention (Video 1).
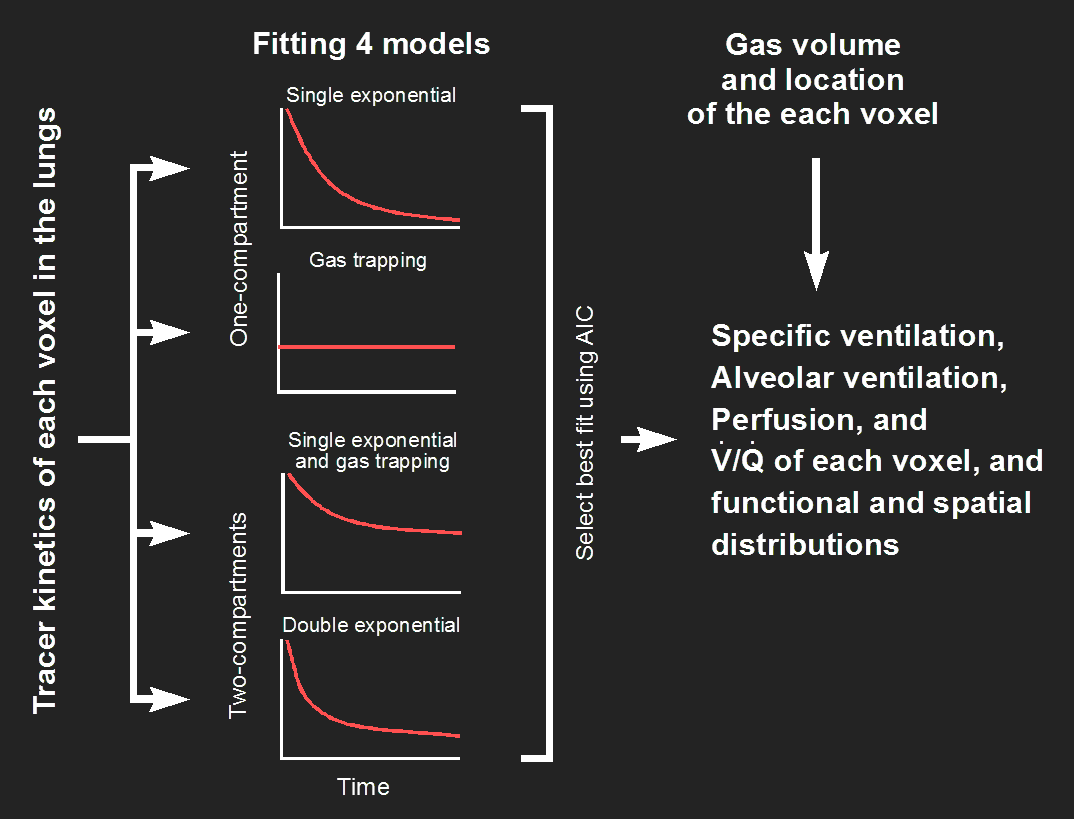
Modeling and parameter estimation
The tracer-kinetics functions of the voxels of the PET image of different regions of interest (ROIs) can be dramatically different from each other if the ventilation is very heterogeneous, e.g., during bronchoconstriction in asthma. We developed for identifying the ventilation and perfusion parameters using four different models for curve fitting and a model selection based on the Akaike Information Criterion (AIC) for selecting the model with the best fit (Fig. 3). Remarkably, modeling of tracer kinetic that are the sum of two different functional compartments allows for the assessment of functional heterogeneity beyond the spatial resolution of the PET scanner.
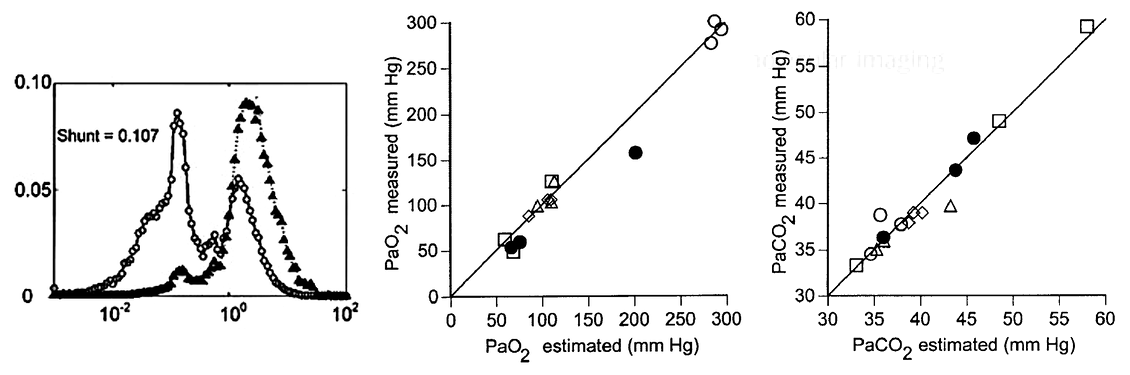
Validation of V/Q imaging
We validated the estimated parameters in large animal studies with major V/Q heterogeneities. Our results show the blood gases predicted blood gases based on V/Q imaging were in excellent agreement with the measured blood gases.
Selected papers using this method
-
Nature 2005;434(7034):777-82. doi: 10.1038/nature03490.
Self-organized patchiness in asthma as a prelude to catastrophic shifts. Jose G Venegas, Tilo Winkler, Guido Musch, Marcos F Vidal Melo, Dominick Layfield, Nora Tgavalekos, Alan J Fischman, Ronald J Callahan, Giacomo Bellani, R Scott Harris.
-
Am J Respir Crit Care Med. 2017;196(7):834-844. doi: 10.1164/rccm.201612-2438OC.
Hypoxic Pulmonary Vasoconstriction Does Not Explain All Regional Perfusion Redistribution in Asthma. Vanessa J Kelly, Kathryn A Hibbert, Puja Kohli, Mamary Kone, Elliot E Greenblatt, Jose G Venegas, Tilo Winkler, R Scott Harris. -
J Nucl Med. 2021 Mar;62(3):405-411. doi: 10.2967/jnumed.120.245977.
PET Imaging Reveals Early Pulmonary Perfusion Abnormalities in HIV Infection Similar to Smoking. Puja Kohli, Vanessa J Kelly , Kathryn A Hibbert , Björn Corleis, Mamary Kone, Josalyn L Cho, Doreen DeFaria-Yeh, Douglas S Kwon, Benjamin D Medoff, R Scott Harris, Tilo Winkler. -
J Nucl Med. 2003 Dec;44(12):1982-91.
Quantification of regional ventilation-perfusion ratios with PET. Marcos F Vidal Melo, Dominick Layfield, R Scott Harris, Kevin O'Neill, Guido Musch, Torsten Richter, Tilo Winkler, Alan J Fischman, Jose G Venegas.